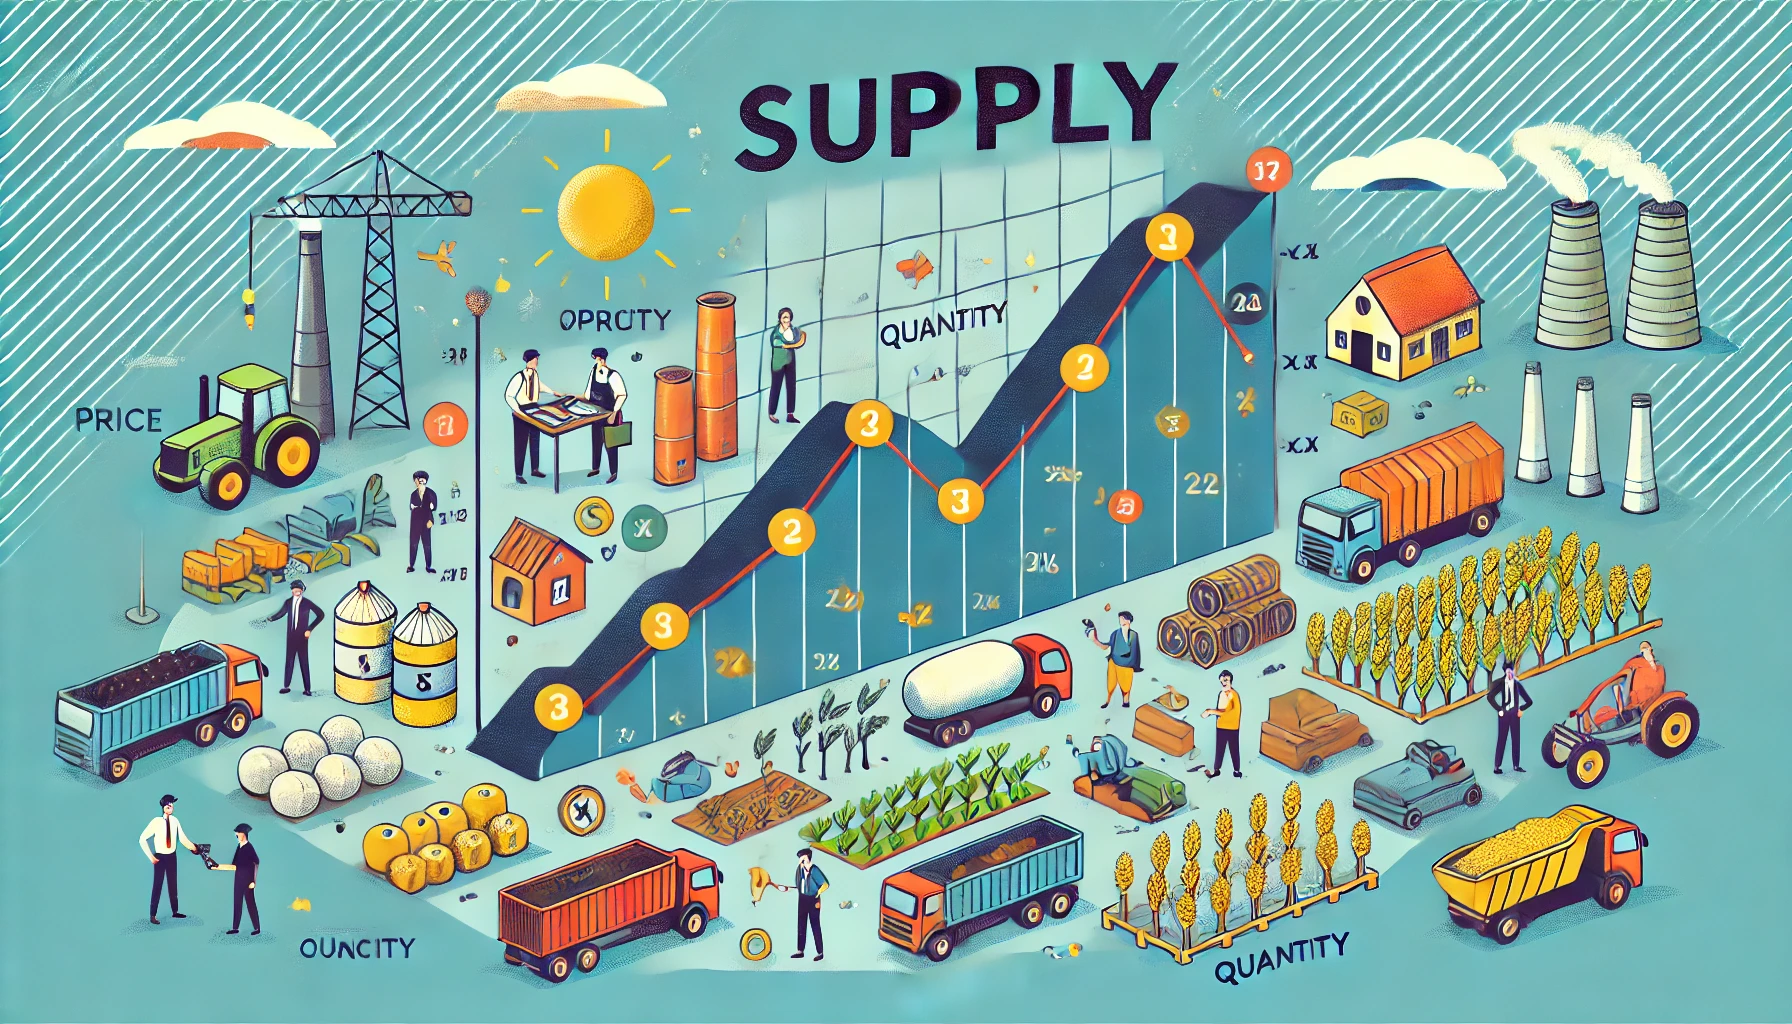
Supply refers to the quantity of a good or service that producers are willing and able to offer for sale at various prices over a given period. It reflects the behavior of producers in the market and is a fundamental concept in economics.
Key Aspects of Supply:
- Quantity Supplied:
- This is the specific amount of a good or service that producers are willing to sell at a particular price point.
- Willingness to Sell:
- Producers must be willing to sell the product, which depends on their assessment of profitability and market conditions.
- Ability to Sell:
- Producers must have the capacity, including the necessary resources and technology, to produce and offer the product for sale.
- Time Period:
- Supply is considered over a specific period, as the ability and willingness to supply goods can change over time.
Law of Supply: The law of supply states that, all else being equal, there is a direct relationship between the price of a good and the quantity supplied. As the price of a good increases, the quantity supplied generally increases, and as the price decreases, the quantity supplied decreases.
Factors Affecting Supply:
- Price of the Good:
- The most direct factor influencing supply is the price of the good itself. Higher prices generally encourage producers to supply more as they can achieve higher revenues and potentially higher profits.
- Production Costs:
- The costs associated with producing a good, including raw materials, labor, and overhead, significantly impact supply. If production costs rise, the supply of the good may decrease because it becomes less profitable to produce.
- Technology:
- Technological advancements can increase supply by making production more efficient, thereby reducing costs and enabling producers to offer more goods at the same or lower prices.
- Prices of Related Goods:
- The supply of a good can be affected by the prices of related goods, such as substitutes or complements in production. For example, if the price of a substitute in production rises, producers may switch to producing that good, reducing the supply of the original good.
- Number of Sellers:
- An increase in the number of sellers in a market typically increases the overall supply of a good. Conversely, if some firms exit the market, supply decreases.
- Expectations:
- Producers’ expectations about future prices can affect current supply. For example, if producers expect prices to increase in the future, they might hold back some of their products to sell later at a higher price, reducing current supply.
- For agricultural products, weather conditions, natural disasters, and other environmental factors can significantly impact supply.
Supply Schedule and Supply Curve
Supply Schedule: A supply schedule is a table that shows the quantity of a good that producers are willing and able to sell at various prices during a specified period.
Example Supply Schedule:
| Price (per unit) | Quantity Supplied (units) |
|---|---|
| $1 | 50 |
| $2 | 100 |
| $3 | 150 |
| $4 | 200 |
| $5 | 250 |
| $6 | 300 |
| $7 | 350 |
| $8 | 400 |
| $9 | 450 |
| $10 | 500 |
In this example, as the price increases, the quantity supplied increases, illustrating the law of supply.
Supply Curve: The supply curve is a graphical representation of the relationship between the price of a good and the quantity supplied. It typically slopes upwards from left to right, indicating that higher prices incentivize producers to supply more of the good.

The supply curve diagram is a graphical representation illustrating the relationship between the price of a good and the quantity supplied by producers. The horizontal axis (X-axis) represents the quantity supplied in units, showing the range of quantities that producers are willing to offer for sale at different price points. The vertical axis (Y-axis) represents the price per unit in dollars, displaying the range of prices at which the product is offered.
Data points plotted on the graph reflect the supply schedule, where each point corresponds to a specific price and its associated quantity supplied. For example, at a price of $1, the quantity supplied is 50 units, whereas at a price of $10, the quantity supplied increases to 500 units. The supply curve itself slopes upward from left to right, illustrating the law of supply, which states that there is a direct relationship between price and quantity supplied. As the price increases, the quantity supplied increases, and vice versa.
The upward slope of the curve indicates that higher prices incentivize producers to supply more of the good, whereas lower prices result in a decrease in the quantity supplied. The curve is smooth and continuous, highlighting the gradual changes in quantity supplied with variations in price. Grid lines are included in the diagram to aid in accurately interpreting the values on both axes.
Overall, the supply curve diagram effectively demonstrates the fundamental economic principle of the law of supply, providing a clear visual representation of how producers’ willingness to offer a product varies directly with its price. This graphical tool is essential for understanding producer behavior and making informed decisions in both economic and business contexts.
Supply is a critical concept in economics that helps in understanding market dynamics and producer behavior. It complements the concept of demand, and together they determine market equilibrium, prices, and the quantity of goods available in the market. Understanding the factors that influence supply allows businesses and policymakers to make informed decisions about production, pricing, and resource allocation.

