Demand refers to the quantity of a good or service that consumers are willing and able to purchase at various prices during a given period. It is a fundamental concept in economics that helps to explain consumer behavior in the market.
Key Aspects of Demand:
- Desire for a Product:
- Demand involves a desire or want for a product. However, desire alone does not constitute demand unless it is backed by the ability to pay and the willingness to purchase.
- Willingness to Pay:
- Consumers must be willing to pay for the product at the given price. This willingness is influenced by factors such as personal preferences, tastes, and the perceived value of the product.
- Ability to Pay:
- Consumers must have the financial means to purchase the product. This is dependent on their income and the price of the product.
- Time Period:
- Demand is always related to a specific time period. For example, the demand for air conditioners may be higher during the summer months compared to winter.
Law of Demand: The law of demand states that, all else being equal, there is an inverse relationship between the price of a good and the quantity demanded. In other words, as the price of a good decreases, the quantity demanded increases, and vice versa.
Factors Affecting Demand:
- Price of the Good:
- The primary factor affecting demand is the price of the good itself. As prices decrease, demand generally increases, and as prices increase, demand tends to decrease.
- Income of Consumers:
- An increase in consumers’ income generally leads to an increase in demand for normal goods (goods for which demand increases as income rises). Conversely, demand for inferior goods (goods for which demand decreases as income rises) may decrease.
- Prices of Related Goods:
- The demand for a good can be affected by the prices of related goods, such as substitutes and complements.
- Substitutes: Goods that can replace each other (e.g., tea and coffee). An increase in the price of one leads to an increase in the demand for the other.
- Complements: Goods that are often used together (e.g., printers and ink cartridges). An increase in the price of one leads to a decrease in the demand for the other.
- Consumer Preferences and Tastes:
- Changes in consumer preferences and tastes can affect demand. For example, if a product becomes fashionable, its demand may increase.
- Expectations:
- If consumers expect prices to rise in the future, they may increase their current demand. Conversely, if they expect prices to fall, they may delay purchases.
- Number of Buyers:
- The more buyers there are in the market, the higher the demand for a product, all else being equal.
- Seasonal Factors:
- Certain products have seasonal demand patterns. For example, demand for winter clothing is higher in colder months.
Demand Curve: The demand curve is a graphical representation of the relationship between the price of a good and the quantity demanded. It typically slopes downwards from left to right, reflecting the inverse relationship between price and quantity demanded.
Demand Schedule: A demand schedule is a table that shows the quantity of a good that consumers are willing and able to purchase at various prices during a specified period.
Example Demand Schedule:
| Price (per unit) | Quantity Demanded (units) |
| $10 | 100 |
| $9 | 150 |
| $8 | 200 |
| $7 | 250 |
| $6 | 300 |
| $5 | 350 |
| $4 | 400 |
| $3 | 450 |
| $2 | 500 |
| $1 | 550 |
In this example, as the price decreases, the quantity demanded increases, illustrating the law of demand.

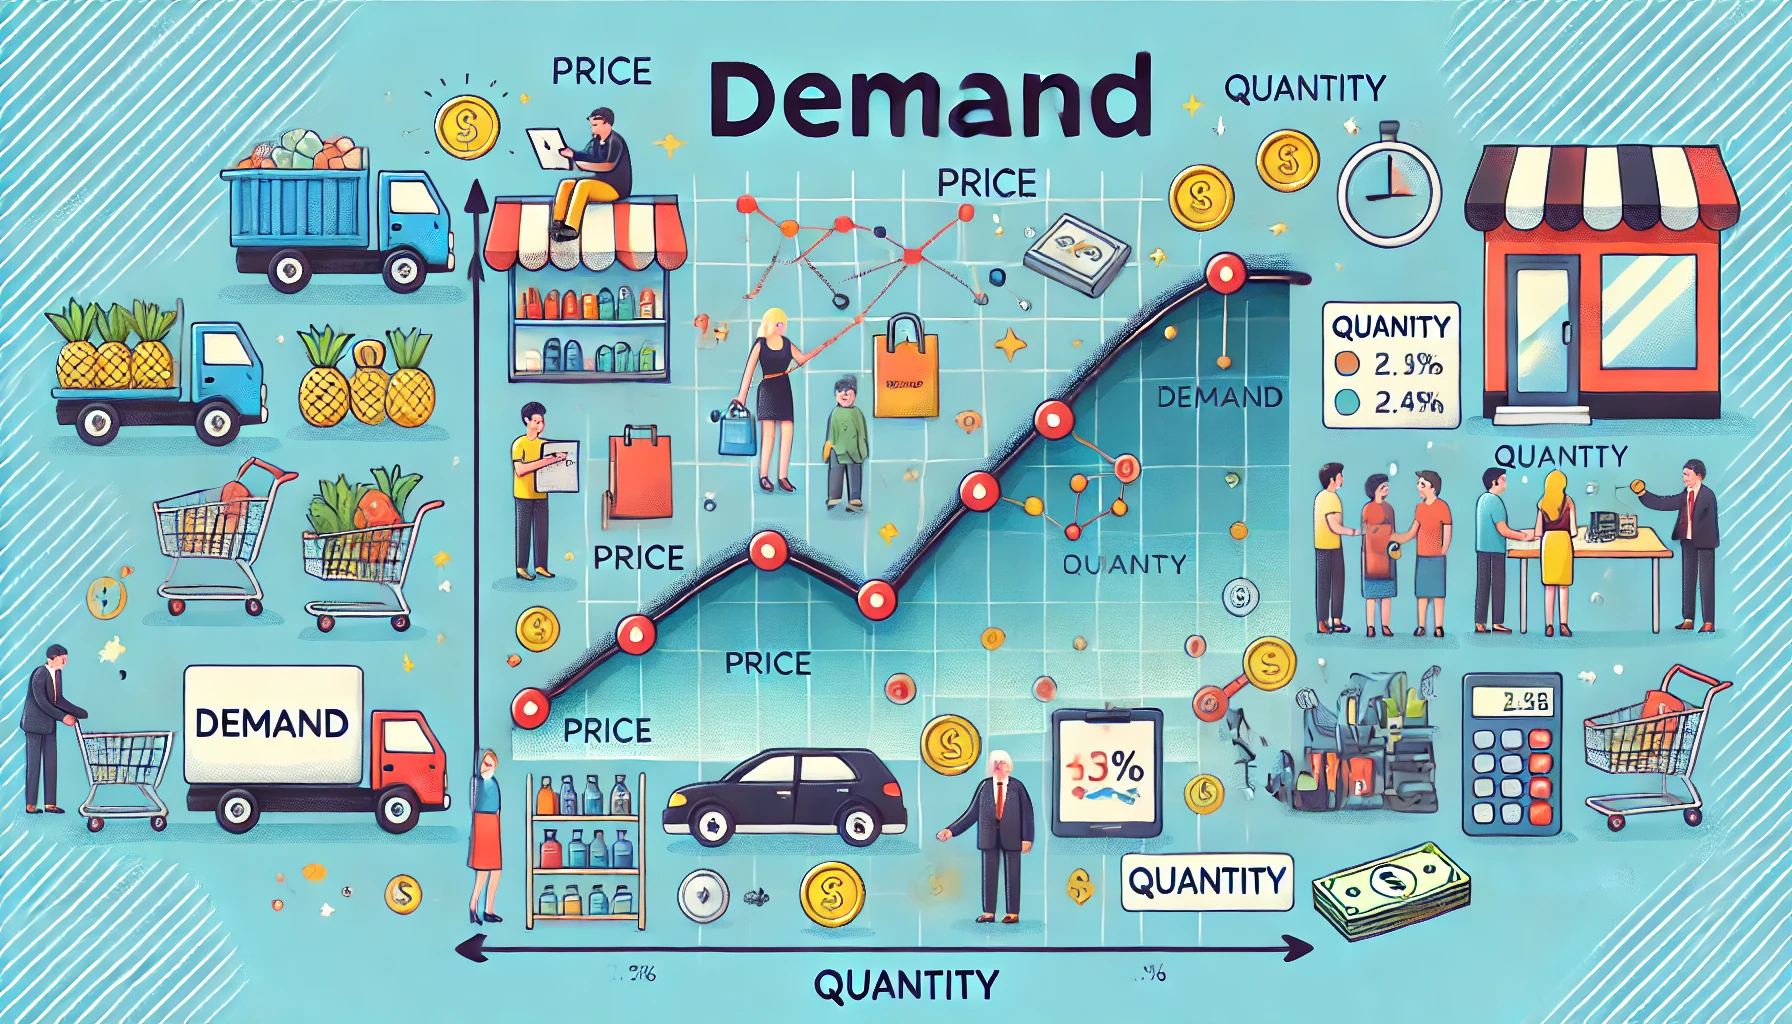
The demand curve diagram is a graphical representation that illustrates the relationship between the price of a good and the quantity demanded by consumers. The horizontal axis (X-axis) represents the quantity demanded in units, showing the range of quantities that consumers are willing to purchase at different price points. The vertical axis (Y-axis) represents the price per unit in dollars, displaying the range of prices at which the product is sold. Data points plotted on the graph reflect the demand schedule, where each point corresponds to a specific price and its associated quantity demanded. For example, at a price of $10, the quantity demanded is 100 units, whereas at a price of $1, the quantity demanded increases to 550 units.
The demand curve itself slopes downward from left to right, illustrating the law of demand, which states that there is an inverse relationship between price and quantity demanded. As the price decreases, the quantity demanded increases, and vice versa. This downward slope indicates that lower prices result in higher quantities demanded by consumers, whereas higher prices lead to a decrease in the quantity demanded. The curve is smooth and continuous, highlighting the gradual changes in quantity demanded with variations in price. Grid lines are included in the diagram to aid in accurately interpreting the values on both axes.
Overall, the demand curve diagram effectively demonstrates the fundamental economic principle of the law of demand, providing a clear visual representation of how consumers’ willingness to purchase a product varies inversely with its price. This graphical tool is essential for understanding consumer behavior and making informed decisions in both economics and business contexts.

